Empowering Christian School Leaders with the (likely) Coming Economic Storm
Read this article if you want to:
- Be EMPOWERED and AT PEACE for your Christian school’s future, regardless of inflation, recession, or both.
- Remain in control of your school’s future enrollment and tuition income, rather than give into the collective angst and external forces over which you have no control.
- Be a shelter from the storm for current parents, new parents, students, teachers and staff – from realistic and tangible strategies that continue to allow parents, students, and staff to grow both in grace and knowledge (2 Peter 3:18).
- To exude a LOVE-based leadership style and organizational culture, not giving into FEAR that is common during difficult economic times. A consequence of this is that the Holy Spirit can more readily work in your school family.
Introduction
Currently, about three-quarters of prominent business economists believe the United States will be in recession in 2023. Inflation will continue, a reasonable estimate for 2023 is between 5-7%. Pragmatically, it seems likely that a recession would not be declared before the 2022 midterms, and politicians will be highly motivated to do something about a recession before the 2024 elections. You can expect significant impacts for both the 23/24 and 24/25 school years.
What has not changed is that for the vast majority of K-12 Christian schools, at least two-thirds of your destiny is in YOUR hands. No more than one-third of your financial enrollment future is external and out of your control.
Can I be blunt with you? We’ve been working with Christian schools since 2006. Frankly I did not know how badly Christian schools were bleeding after the Great Recession. According to a working paper by Anne Lamb and Preeya Mbekeani, private schools lost one-third of all students due to the Great Recession, to a low of about 8.5% of all K-12 students in 2013.[1]
Our schools grew – about 80%. I suppose I was too determined and stubborn to fail. I looked for every possible marketing / admissions that was within the control of the school, and how we could improve it. Out of that crucible were born the strategies and tactics that we teach everyone today. We tried new things because we had no choice – for many of our schools, their very existence was on the line.
What’s different today is that today we know so much more – by multiples. We have amazing tools, such as our Enrollment Pro Dashboard. We have worked out a ministry- and research based approach to enrollment closing that covers everything about the process (about 300 slides.) Ditto tuition and financial aid – 30 lessons worth of material.
In other words, we have formalized everything that was initially developed during the Great Recession. Just in time for the next one.
I want to explain what is likely to happen for the 23/24 and 24/25 school years, and then provide you practical principals and strategies to help you both survive, and thrive.
First, let’s talk about the likely upcoming recession, and lessons learned from previous recessions, particularly the 2008-2010 Great Recession.
Stagflation: Summarizing the Challenges for Christian Schools like Yours
Stagflation is the combination of higher than normal inflation with an overall decrease in the output of an economy. In short: Stagflation = high Inflation with Recession, at the same time. Note that those two do not generally happen at the same time.
If you are younger than 50, you either weren’t born, or don’t remember much about the last time this happened, from 1979 to 1983. Before that, most economists did not think stagflation was even possible. After we finally fixed it in the early 80 – with significant pain – many economists such as Alan Greenspan believed we were too smart to let it happen again.
Yet here we are. Most likely we will be in a recession in 2023 with inflation rates declining from the current 9% to at least 5% by the end of 2023. Note that many other countries around the world are, or soon will be, in recession as well. This is a world-wide issue. In many ways, the United States is actually better off than most other countries. That the dollar is the world’s currency of choice gives the United States a tremendous advantage.
Stagflation: Why Now
As I write this, the Federal Reserve just raised the prime rate 0.75%, making the effective prime rate 6.25%. Three out of 4 business economists believe America will fall into a recession in 2023. Increases in the prime rate do eventually result in lowered inflation rates – as Paul Volcker demonstrated when his Federal Reserve raised the effective prime rate all the way to 20.5% in 1980.
Consequently, inflation decreased from 13% annually in 1980, to 9% in 1981. After that, the inflation rate was 4% for the next four years, finally falling to just 1% in 1986. That’s the good news. The bad news is that most of the world, including the United States, fell into the most severe recession since the Great Depression, up to that time.
There are three reasons why prime rate increase eventually cause recessions. The obvious one is that increased borrowing costs decreases demand as consumers cannot afford to buy on credit. Less obvious: Much of the world’s debt is tied to the US dollar. With higher borrowing costs, smaller countries particularly are likely to have severe recessions. The European Union is in deep trouble, exacerbated by high prices and shortages of natural gas, caused by the Russian-Ukraine war.
Because interest rates were so low in the last few years, many corporations took on a great deal of debt. If that debt was short term, these businesses will have to refinance at a much higher rate. To pay for it, they have to cut back in other ways – most notably layoffs.
Recessions in other countries, the unproductive zero-Covid policies of China, and corporate cutbacks will increase supply chain problems in the United States. Not to mention that higher interest rates make it much more expensive to carry a large inventory.
Even less well known to the public is this: Much of the financial sector is “addicted” to cheap debt. When the Prime Rate goes up again, at least half a percent towards the end of the year, do not be surprised by a sudden and dramatic stock market decline in the months ahead. A stock market decline of 20%+ is likely in the next 14 months.
Nouriel Roubini, who publicly and correctly predicted the 2008 recession years in advance, believes a stock market decline of 40% is more likely, with full-blown recession starting by the end of this year. He describes the upcoming recession as “long and ugly.” Roubini and many other economists point out that Federal Reserve is between a rock – reducing inflation by raising interest rates – and a hard place – causing a recession by raising interest rates. Many are questioning whether the current Federal Reserve has the courage to raise interest rates as high as Paul Volker did to solve the inflation. If so, high inflation will be longer lived than it was in the early 80s.
Graphically, here’s the impact of inflation and recession on Private School enrollment:
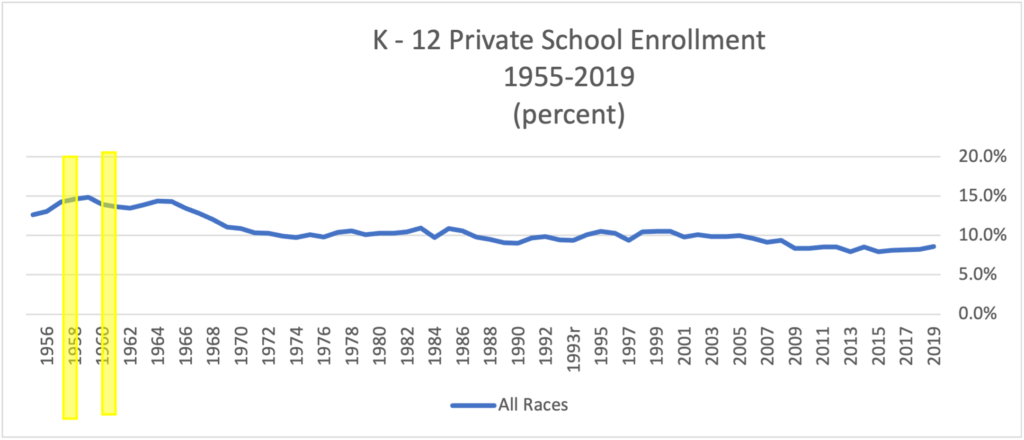
First, inflation. Two of the last three inflationary periods had private school enrollment decline. However, the other longest one (1973 to 1982) was a period of flat enrollment percentage-wise for all private schools. Our conclusion is that the higher income parents private schools serve were more insulated from inflations effects.
Now the recessions. the percentage of students enrolled in private schools declined in four of the last eight recessions, increased in two, and stayed flat in two. Private school enrollment faltered at other times as well, with relatively sound economic conditions, notably 1984 and 1997.
Note the significant long-term decline in private school enrollments from the Great Recession of 2007-2009.
Now let’s look consider the uneven impacts of economic downturns.
Stagflation’s Impacts: NOT Across the Board
Types and denominations of schools fared differently during and after the Great Recession.
The important part of this is to understand that Christian schools have increasingly become filled with higher income families. In GraceWorks’ surveys, I regularly find that 55% or more of households are making more than $100,000 a year, which is roughly the top income quartile in most parts of the United States.
How did this happen? The middle class hollowed out, plain and simple. GraceWorks has been collecting income from parents only from 2006 in our Parent Satisfaction and Referral Survey. Analyzing 15 years’ worth of data, note the decline of parents with a household income of $50,000 to $99,999, and the increase of parents making more than $100,000.
A key reason Roman Catholic and Lutheran Schools have lost students and/or closed is that they served middle class families, who could not afford even their discounted rates.[2]
Here’s two implications of this.
Implication #1:
Do you know the income ranges of your parents? You need to. You can know for only $995 using GraceWorks’ Christian School Comprehensive Survey. In fact, the survey tells you how satisfied each of the various income levels are.
While the hallowing out of the Middle Class had been going on for some time, the Great Recession accelerated this trend substantially, as documented by Elizabeth Currid-Halket:
[T]he Great Recession fundamentally changed consumption habits: The richer households now spend significantly less on conspicuously consumption and more on inconspicuous consumption, while the middle class only significantly reduced its conspicuous consumption through the crisis … the wealthy and the middle class are exhibiting almost opposite spending patterns. Nowhere is this more evident than in the consumption that counts In education, health care, pensions, and personal insurance, the top income groups (particularly the top 1%) are spending much more than the middle class both in absolute dollars and share of total expenditures. These are not small numbers. The top 1-5% spend on average 5% of their total expenditures on education, while the middle class barely spends 1% on education.
Since the Great Recession, there has been a gradual overall uptick in top income group education spending and a decline in the middle class’s educational consumption. In 2014, the top 1% spent 3.5 times more in absolute dollars and share of expenditures on education then they did in 1996. In 2014, they spent 860% more than the national average while the middle class spent 50% less and the lower income spent 70% less than the national average on education. Despite skyrocketing college tuition, as a share of expenditures, the poor and middle-class income groups are spending exactly the same as they did in 1996 on education, and less than a quarter of what the top income groups devote a share of total expenditures. Education is perhaps the biggest tangible example of the divide between the haves and have-nots in America. The results suggest that the middle class and lower income groups are not deprioritizing education, but they simply cannot afford the rising tuition fees across all levels of education from preschool to high school to college.[3]
During and after the Great Recession, financial winners and losers in K-12 Christian education come down to who is largely serving higher income families, and who is largely serving middle class or lower families. On the surface, the above spells DOOM for many Lutheran churches – Missouri Synod, Roman Catholic, and Adventist schools that seem to be largely reaching out to middle- or lower-income families. In fact, roughly a quarter of Lutheran schools have closed since 2000[4], and the declines in Roman Catholic elementary and secondary education are widely known.
Implication #2:
It is simply getting harder and harder to justify a tuition rate lower than the cost to educate a child at your school. Most likely, a majority of families can afford to pay the full cost to educate their child – and this is an entirely knowable question. In short-hand, can they – do your parents have the financial wherewithal. You can find this out on your own with some sort of survey.
Consider the related question: Will they. Are they satisfied with the value of your program that they will pay a higher tuition (even if they aren’t happy about it.) The only way to know is cross tabbing satisfaction by income level, and comparing to other schools’ results. That’s impossible for an individual school to do, but the good news is that GraceWorks’ Christian Schools Comprehensive survey can do it for you, starting at only $995.
The families who need it are in the minority. Their needs can be met with financial aid. Many of these already are receiving financial aid. For a larger tuition increase, it’s the families who will now have to apply for financial aid that are concerning – often the $75K to 99K. Here the “Will they” is the most important question of the two.
An important safety tip here: You cannot raise tuition rates dramatically and then just send a letter. Don’t even think about it. There is a whole change process that needs to be followed. Space does not allow the 5 or so pages it would take to explain the process we have done successfully with dozens of Christian schools. If you know you a substantial tuition increase / automatic discount reduction is in your future, please reach out for help. My number is (719)278-9600, ext. 100.
The Best Way to Predict the Future is MAKE IT.
Let’s dive in to what you can do to control your own destiny, even in the midst of a perilous economy.
The Foundation to Control Your Destiny: Lead Metrics
Here’s three key points from the important book The Four Disciplines of Execution, (Chris McChesney, Sean Covey, and Jim Huling):
(1) All of us perform better focused on fewer goals – no more than two,
(2) Therefore, we must choose which goals really matter to our success,
(3) These goals must be predictive of success and influenceable “as we go.”
An example outside of Christian schools of these goals – or lead metrics – are an obsession with overall customer satisfaction, often expressed in a Net Promoter Score ™. The idea is that more satisfied customers will result in more loyalty and referral of new customers, increasing revenues and profits. Paul O’Neill famously turned around the aging behemoth Alcoa with a lead metric related to worker safety. A million-dollar investment in Alcoa stock at the beginning of O’Neil’s tenure would have resulted in five million dollars in profits at the end.
After 14 years of fulltime consulting with Christian schools, here are the overall lead metrics for a Christian school. I am assigning responsibilities for the accomplishment of each goal for a big school.
Lead Metrics for Large Christian Schools
| Area | Lead Metric | Responsibility |
|---|---|---|
| Improve program quality | Percentile rank of Satisfaction / Willingness to refer compared to other North American Christian schools. (Includes by grade level) | Entire educational team – broken out by sphere of influence. (e.g. 4th grade teachers in charge of 4th grade scores.) |
| Generate more leads | Number of students represented by qualified families visiting the school at least once | Admissions |
| Close more leads | Percent of students from visiting qualified families above who actually enroll. | Admissions |
| Retain more students | Percentage of eligible students who are re-enrolled, excluding situations such as families who are moving out of the area. | Principal / Vice Principal for each area |
| Increase overall tuition income / meet tuition income budget (includes effectiveness of financial aid / discount programs) | Full Cost Equivalents by division | Business office or admissions – accounting for each division Principals – Results for each division |
| Strength / Enthusiasm for overall vision and brand | Volunteer hours (with no incentive programs) | Vision-setter. (Top executive or board) |
Six essential areas to grow a large Christian school. One lead metric per area. No more than two key goals, two key metrics, per person.
Simple enough, right?
How Things Go Awry
It’s hard to put into words all the ways that a simple plan like the above goes awry, but let me try.
(1) Focusing on the wrong thing. I knew a school of over 700 students that was getting 15-20 leads a week through a Hubspot program. Not good leads, mind you, but leads. In the end, they had over 500 leads on paper – but net enrollment increased only 21 students. Yes, you read that right – 21 students.
The focus was on the wrong thing. It has to be more than names. The correct focus needed to be getting people in the building. That is the correct lead metric for generating leads – in fact we say Christian schools need to generate good leads, leads that actually visit. If the leadership of this school had insisted that admissions be accountable for the number of VISITS, the outcome would have been dramatically different. How? Because the campaign would have been tweaked to have fewer leads who were more responsive and willing to visit. Because the campaign would have encouraged potential customers to simply visit or call.
While it is very good for Hubspot to generate all sorts of paper leads on an electronic form – another stunning success – it really may not be that good for you. Lots of social media / internet issues need to be thought through this way. A lead is a lead is a lead to most internet vendors, but that’s clearly not so. What’s required is a different way of thinking about what we really need in a lead. Do NOT assume the problem is you if these “paper leads” end up not visiting. It could be the wording of the Facebook lead ad (or Google pay per click), landing page issues, and/or the call to action. Or the wrong demographics are being targeted.
(2) Understand the problem, but don’t have time to fix it. I see this all the time with big and small schools alike. It’s why my conclusion is that when it comes to helping a school as an outsider, my best contribution is to build time-saving tools.
I have worked with big Christian schools who heartily agree that the correct metric is students represented by the qualified families who actually visit. And yet month after month they struggle to pull together this crucial lead metric. Admissions staff almost resent this intrusion on their time, because so many other priorities could directly result in new student admissions. As the paid consultant, I can insist, but often, it never really becomes a part of their organizational habit and culture.
And yet, unless we step back and sharpen the saw, all of us will work hard, but get the same results we are getting. Because ultimately advertising practices must change if the correct metric is the number of students in families who visit us at least one time. If we don’t track it, we don’t know and we don’t change.
I know a school with well over 700 interested students and families in their last marketing season. Prospects. More than enough to enroll 300 new students. While they did enroll about 210, that extra 90 will require better tools, better systems. To be clear, another staff person won’t do it either – I have watched that play out in several large school situations. It’s the system that is the problem, not the staff.
If you understand the problem, but don’t have time to fix it, then you need a tool. Or a better system.
(3) The #1 income source for a Christian school – Net Tuition Income, is typically on auto-pilot. Worse, financially Christian schools are tracking the wrong thing – the money they give away. What needs to be tracked is the money you keep. This should be done student by student, as you go. The bad news is that it’s really hard to do. The good news is that GraceWorks spent thousands of dollars working this out in a lead metric format, through the Enrollment Pro Dashboard.
This is our Full Cost Equivalent system. Full Cost Equivalents are in fact a lead metric. What is abundantly clear is that making budget decisions based on the number of students is inherently risky – because both financial aid and discounts vary considerably student to student and year to year. I know a large school where top leadership was chagrined to learn that after achieving the stated enrollment goal, $300,000 in cuts would still be necessary – because the impact of automatic discounts for a type of family was not tracked until the end. If you have heard that money can be demotivating, this is the poster child case for it
I developed the Full Cost Equivalent system out of too many conversations, typically in late May, about the need to hire or fire teachers. Even if you know the nets of currently enrolled students, to make wise decisions here you still need to know the anticipated value of your “funnel” – prospects that are “Probable” or “In Process”. Our Enrollment Pro Dashboard does that – as you go.
The obvious fact is that during a recession, you will be giving away more financial aid to keep some families. More than ever you do need to know your net tuition income, as you go. That will help you make better financial aid decisions, as well. (Translation: Not being overly generous in awards.)
Conclusion
Good lead metrics are empowering because they help you understand the kinds of questions you need to ask to improve.
For example, on the new student front, there are really just two questions your marketing / admissions person has to focus on:
Generating Good Leads: How do we generate qualified leads that are highly likely to visit? I’m sure in 60 minutes I could generate three dozen answers to that question. These questions also give you focus. If you notice, for example, that word of mouth leads are more likely to visit, you would put more energy into your word of mouth efforts. Or if leads coming from your website are generating more visits than your Facebook lead ads, then it would make sense to allocate more time and money to the website, and less to Facebook lead ads. In addition, it’s clear that how we present the enrollment closing process will make a difference in who actually visits.
Closing More Leads: What can we do to increase the percentage of families who enroll after they visit at least once? Here again there are many answers to this question. Some are very basic, such as having the Principal meet with prospective families first. Some are more subtle, such as doing the tour AFTER the Principal meeting, not before. Or following up according to the parents needs and schedule, rather than some predetermined number of days.
Even more ephemeral concerns, such as Branding and Visioning, lend themselves both to a lead metric and a question. The question is: How can I get more consistuents wildly enthusiastic about about our school. We think tracking volunteer hours is an excellent lead metric to track enthusiasm in the vision and mission of your school. The most valuable thing a parent can give you is their time.
Thank you for taking the time to read through this document. We are here to help you. You can call me directly at (719)278-9600, ext. 100, to set an appointment for a whole hour of wisdom and counsel, without charge or obligation.
[1] Private school choice in the wake of the Great Recession Anne T. Lamb Harvard University Preeya P. Mbekeani Harvard University February 2017 https://aefpweb.org/sites/default/files/webform/42/Lamb%20&%20Mbekeani_AEFP.pdf
[2] There are any number of books that explain the United States’ economic fragmentation, such as Joseph Stliglitz, The Price of Inequality, 2012.
[3] Elizabeth Currid-Halkett, The Sum of Small Things: A Theory of the Aspirational Class, 2017, pp. 69-70. Murname and Reardon, previously cited, document the same thing.
[4] Interview with Bill Cochran, now retired National Education Director for the Lutheran-Church, Missouri Synod. The decline seems likely for ELCA schools as well, but not as bad for the Wisconsin Lutherans. The Catholic numbers are documented above.